zabbix监控mysql数据库状态

        Zabbix自己提供的模板可以监控mysql slow queries,mysqlversion,uptime,alive等。

  1. Zabbix官方提供的监控mysql的模板Template AppMySQL,可以看到相关的Items和key。

  2. 把该模板Template App MySQL Link到相关的主机上面,发现Item的Status是不可用的,因为key的值是通过Mysql用户查看”showglobal status”信息或者用mysqladmin命令查看status或extended-status的信息而取的值。

1
2
mysql> show global status;
mysql> show status;
  1. 结合官方提供的key编写Shell脚本,从数据库中取出Items的key的值。
1
2
3
4
5
6
7
8
9
10
11
12
13
14
15
16
17
18
19
20
21
22
23
24
25
26
27
28
29
30
31
32
33
34
35
36
37
38
39
40
41
42
43
44
45
46
47
48
49
50
51
52
53
54
55
56
57
58
59
60
61
62
63
#!/bin/sh
#Create by huxianglin 2015.04.14
MYSQL_SOCK="/tmp/mysql.sock"
MYSQL_PWD=xxxxxx
source /etc/profile.d/mysqld.sh
ARGS=1
if [ $# -ne "$ARGS" ];then
echo "Please input onearguement:"
fi
case $1 in
Uptime)
result=`mysqladmin -uroot-p${MYSQL_PWD} -S $MYSQL_SOCK status|cut -f2 -d":"|cut -f1 -d"T"`
echo $result
;;
Com_update)
result=`mysqladmin -uroot-p${MYSQL_PWD} -S $MYSQL_SOCK extended-status |grep -w "Com_update"|cut -d"|" -f3`
echo $result
;;
Slow_queries)
result=`mysqladmin -uroot -p${MYSQL_PWD} -S $MYSQL_SOCK status |cut -f5 -d":"|cut -f1 -d"O"`
echo $result
;;
Com_select)
result=`mysqladmin -uroot-p${MYSQL_PWD} -S $MYSQL_SOCK extended-status |grep -w "Com_select"|cut -d"|" -f3`
echo $result
;;
Com_rollback)
result=`mysqladmin -uroot-p${MYSQL_PWD} -S $MYSQL_SOCK extended-status |grep -w "Com_rollback"|cut -d"|" -f3`
echo $result
;;
Questions)
result=`mysqladmin -uroot -p${MYSQL_PWD} -S $MYSQL_SOCK status|cut -f4 -d":"|cut -f1 -d"S"`
echo $result
;;
Com_insert)
result=`mysqladmin -uroot-p${MYSQL_PWD} -S $MYSQL_SOCK extended-status |grep -w "Com_insert"|cut -d"|" -f3`
echo $result
;;
Com_delete)
result=`mysqladmin -uroot-p${MYSQL_PWD} -S $MYSQL_SOCK extended-status |grep -w "Com_delete"|cut -d"|" -f3`
echo $result
;;
Com_commit)
result=`mysqladmin -uroot-p${MYSQL_PWD} -S $MYSQL_SOCK extended-status |grep -w "Com_commit"|cut -d"|" -f3`
echo $result
;;
Bytes_sent)
result=`mysqladmin -uroot-p${MYSQL_PWD} -S $MYSQL_SOCK extended-status |grep -w "Bytes_sent"|cut -d"|" -f3`
echo $result
;;
Bytes_received)
result=`mysqladmin -uroot-p${MYSQL_PWD} -S $MYSQL_SOCK extended-status |grep -w "Bytes_received" |cut -d"|" -f3`
echo $result
;;
Com_begin)
result=`mysqladmin -uroot-p${MYSQL_PWD} -S $MYSQL_SOCK extended-status |grep -w "Com_begin"|cut -d"|" -f3`
echo $result
;;
*)
echo"Usage:$0(Uptime|Com_update|Slow_queries|Com_select|Com_rollback|Questions)"
;;
esac

        修改权限chmod 755 /etc/zabbix-2.4.4/scripts/checkmysqlperformance.sh

  1. 在Zabbix_agentd.conf里面添加UserParameter,格式如下,对于Zabbix来说,脚本其实就是一个插件。
  • UserParameter=mysql.version,mysql -V
  • UserParameter=mysql.ping,mysqladmin -uroot -pxxxxxx -S /tmp/mysql.sock ping | grep -c alive
  • UserParameter=mysql.status[*],/etc/zabbix-2.4.4/scripts/checkmysqlperformance.sh $1 $2
  • 重启agentd服务器,然后在zabbix server中添加模板Template AppMySQL。
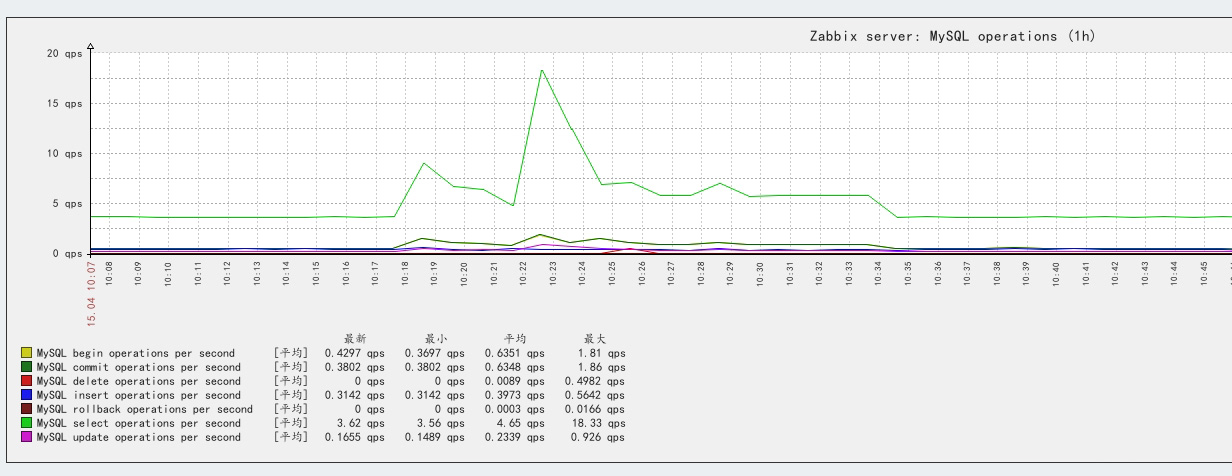
  • 在zabbix前端可以实时查看SQL语句每秒钟的操作次数。

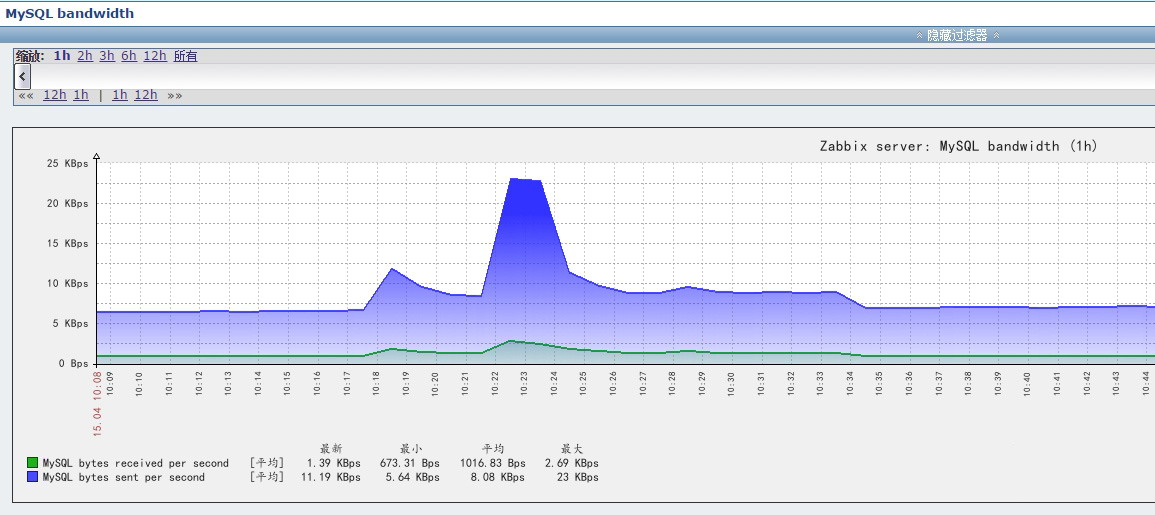
  • 在zabbix前端可以实时查看mysql发送接收的字节数。其中bytes received表示从所有客户端接收到的字节数,bytes sent表示发送给所有客户端的字节数。

总结

        把该脚本放到要监控的服务器上面(Modifymysql user and password),修改UserParameter的参数并重启agentd,Link官方提供的Template App MySQL模板即可。

        这里是测试环境用root账号,线上服务器安全期间可以给mysql用户授权readonly权限。

        根据实际的需求,除了监控上述监控项之外,还可以监控mysqlprocesslist,Innodb等。